> ## Documentation Index
> Fetch the complete documentation index at: https://statsig-4b2ff144-mintlify-add-local-eval-country-note-96362.mintlify.site/llms.txt
> Use this file to discover all available pages before exploring further.
# Experiment Result Exports
## Overview
Your data is your data. Statsig makes it easy to export both the reports and the raw data your feature rollouts and experiments generate.
## How to
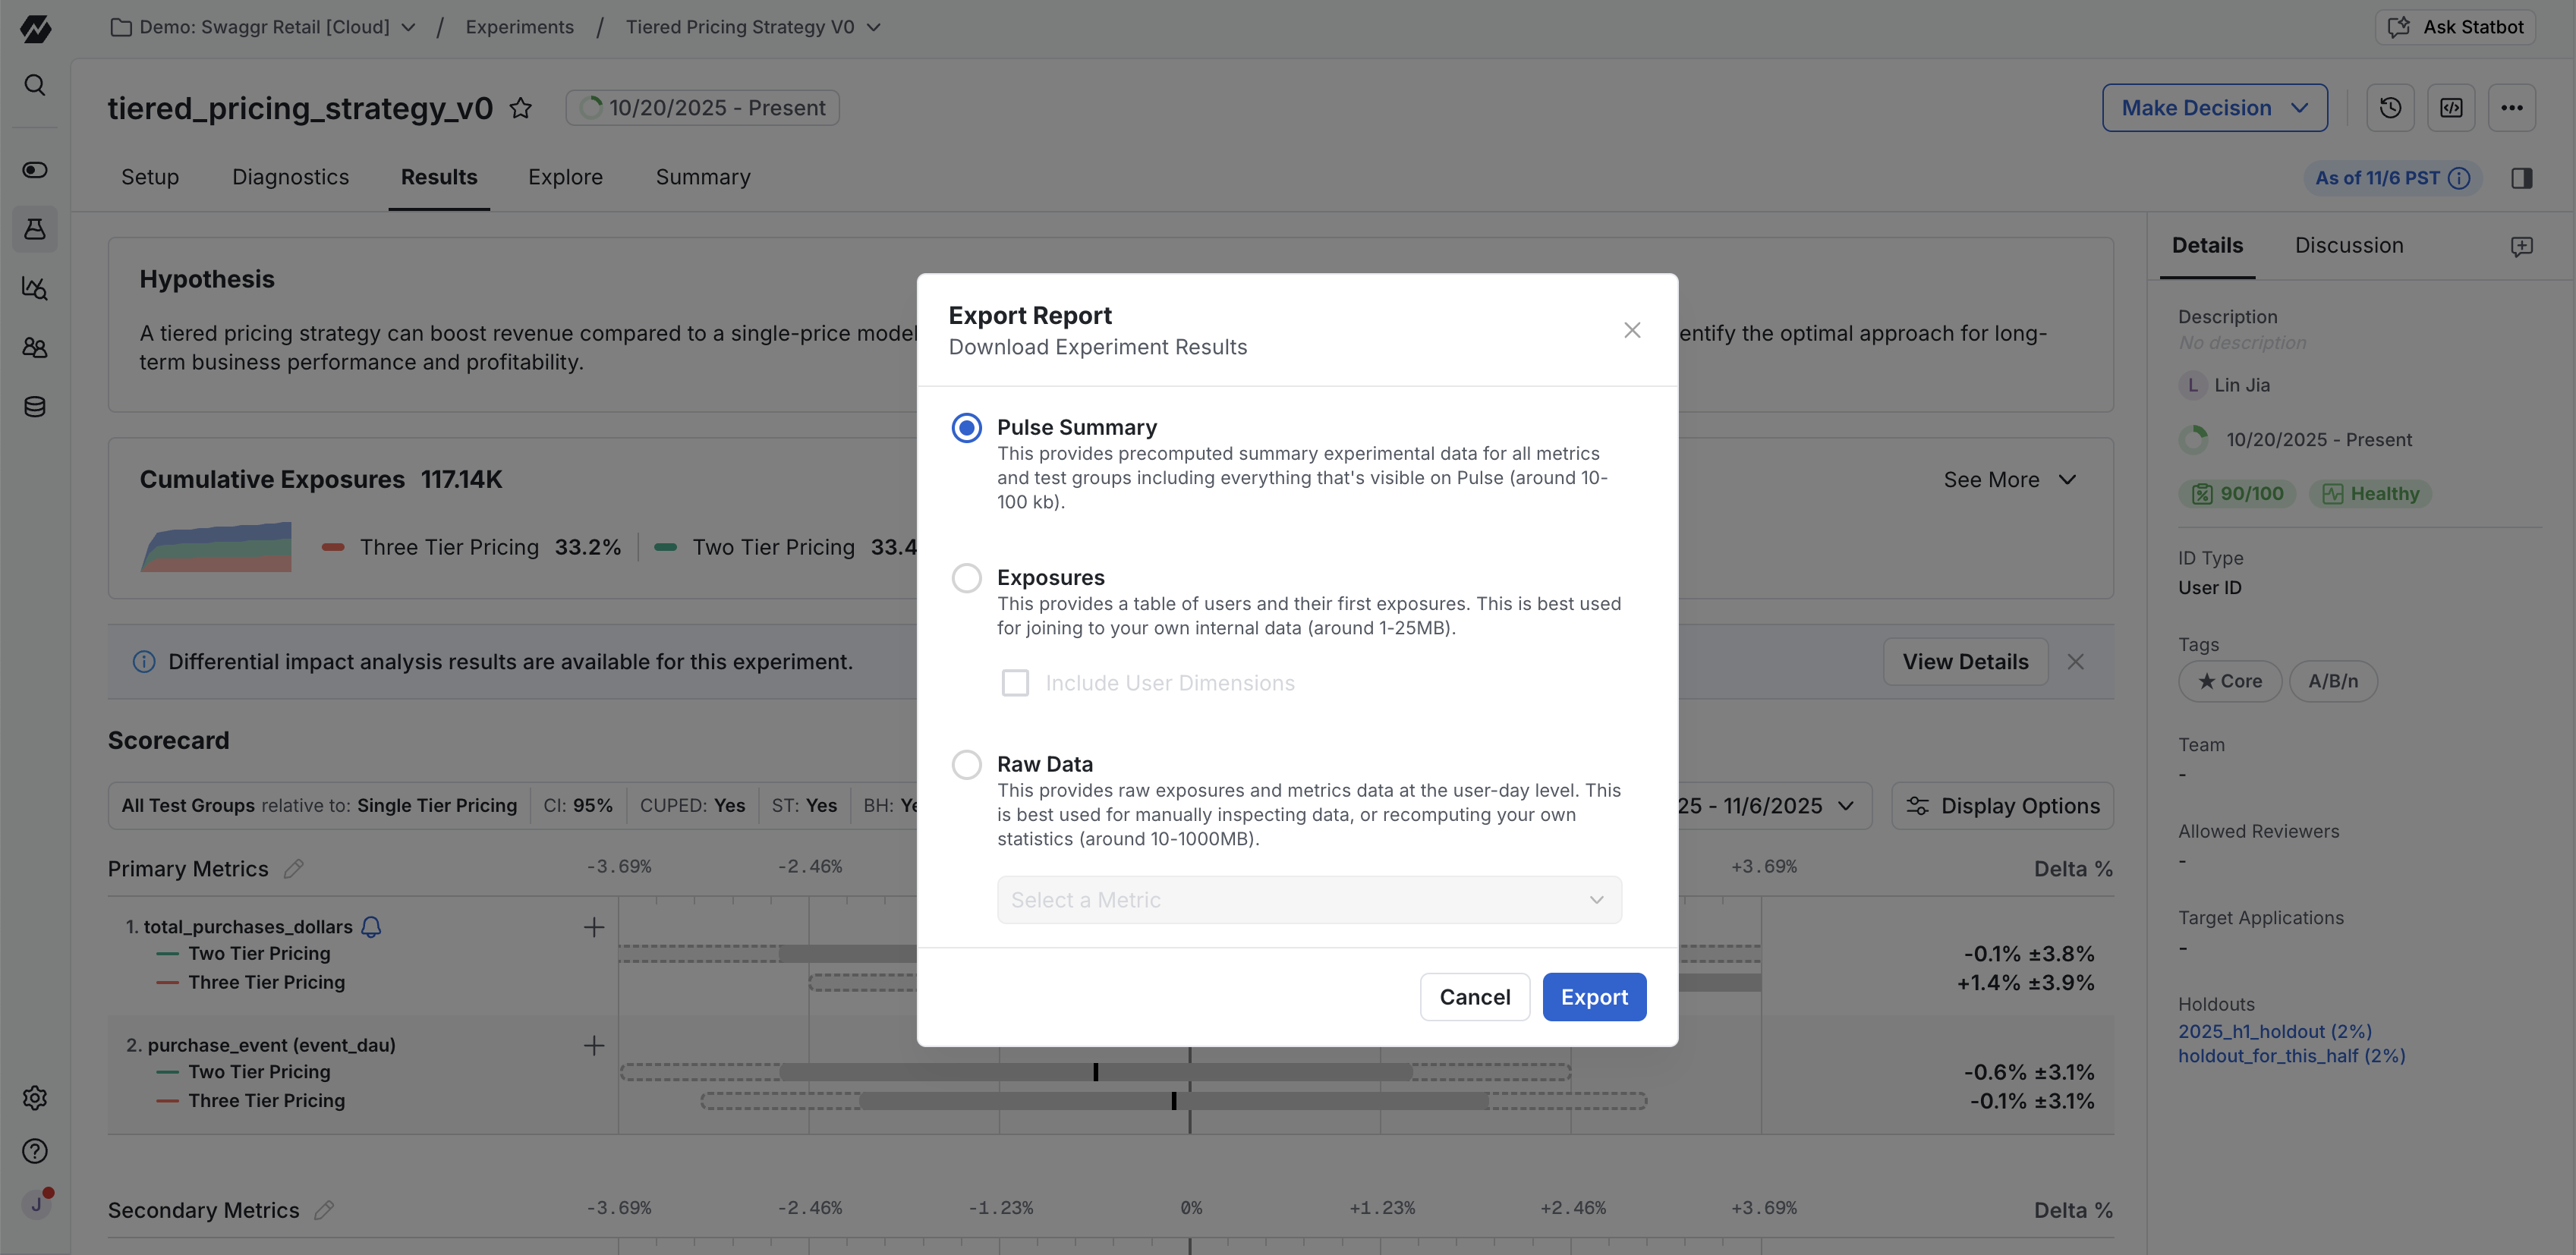
1. [Download experiment results](/pulse/export#how-to-export-pulse-data) from the Console as a CSV file - including a summary view, exposures and the raw data. This is meant for one-off downloads/analysis.
 2. [Programmatically export the data underlying Pulse](/console-api/daily-reports).
3. For ongoing data exports we support [data integrations](/integrations/introduction) via customer data platforms like Segment, RudderStack and mParticle. There is also a [generic webhook](/integrations/event_webhook) if you want to build your own integration. If you want to set up a daily export into your data warehouse, see [Data Warehouse Exports](/integration/data-exports/data_warehouse_exports).
2. [Programmatically export the data underlying Pulse](/console-api/daily-reports).
3. For ongoing data exports we support [data integrations](/integrations/introduction) via customer data platforms like Segment, RudderStack and mParticle. There is also a [generic webhook](/integrations/event_webhook) if you want to build your own integration. If you want to set up a daily export into your data warehouse, see [Data Warehouse Exports](/integration/data-exports/data_warehouse_exports).
 ## Validating data
Many teams audit and compare their data in Statsig with what they have in other systems. There are no black box algorithms. We use well-recognized statistical methods and industry best practices and you should be able to reproduce results yourself.
Some tips when doing so -
1. Start small: Use a day's worth of data to reduce the variables in play. When comparing experiments, start with a full day (not days the experiment started/stopped where there's partial data).
2. Third party ads/tracking blockers can block events sent to 3rd party services. Using a server side integration or [proxying requests via your domain](/custom_proxy) will remove this.
3. Watch for time zone conversion issues to make sure a consistent definition of day is being used.
4. Statsig applies [winsorization](/stats-engine/variance_reduction#winsorization) on metrics to remove outliers.
5. Statsig applies CUPED to get faster experimental results (reduce variance on metrics using pre-experimental data). Turn this off when looking at results in the console and comparing them.
## Validating data
Many teams audit and compare their data in Statsig with what they have in other systems. There are no black box algorithms. We use well-recognized statistical methods and industry best practices and you should be able to reproduce results yourself.
Some tips when doing so -
1. Start small: Use a day's worth of data to reduce the variables in play. When comparing experiments, start with a full day (not days the experiment started/stopped where there's partial data).
2. Third party ads/tracking blockers can block events sent to 3rd party services. Using a server side integration or [proxying requests via your domain](/custom_proxy) will remove this.
3. Watch for time zone conversion issues to make sure a consistent definition of day is being used.
4. Statsig applies [winsorization](/stats-engine/variance_reduction#winsorization) on metrics to remove outliers.
5. Statsig applies CUPED to get faster experimental results (reduce variance on metrics using pre-experimental data). Turn this off when looking at results in the console and comparing them.